Dimensions
Introduction
Datasources often have specific properties that you want to filter on. These properties can be global, like time and height, or more unique to your data. As an HxGN Smart Sites Admin, you can enable the filter capability for users by setting a Dimension on your Datasource.
Users then control the Dimensions on the HxGN Smart Sites Client in the form of Widgets.
Define a Dimension
- Access the HxGN Smart Sites Admin Page.
- Go to the
Datasourcespage. - Click the Datasource you want to define a Dimension for.
- Click the
Dimensionstab. - Click the
+icon to add a Dimension. - Choose a Widget type.
- Click
Save.
Which type of Widget(s) you can choose depends on the protocol of your Datasource, see Protocols & Widget types.
Widget types
Select Widget
The Select Widget allows filtering on properties specific to that Datasource.
Fill out the Name of the property you wish to filter on. This must match the definition in your data exactly.
Next, set a Title for the property, to be displayed in the Widget.
You can add specific Values to filter the property on using the + icon underneath 'Select options'.
Again, these must match the range of values of the property in your original data.
Like the property, you can set a Display Name for the values.
To finalize, click Save.
Height Widget
As the name suggests, this Widget allows you to filter Datasources based on height values. These can come from 3D data, but equally from a WMS with an altitude dimension or a specific property of a WFS.
Extends from/to sets the available range for the height filter.
You set the start values of the filter using the Initial Min/Max Value.
A user may adapt these values within the Extends range using the Widget on the HxGN Smart Sites Client.
Most Datasources provide height readings as altitude: the vertical difference between a reference datum
and the point of measurement.
If you want to measure the true height of an object, you want the distance from this reference point to the ground.
To achieve this, you can set an Offset from terrain.
This expresses the difference between the reference datum and the ground, and is then subtracted from the altitude to
achieve the height.
When you’ve configured what you wanted, click Save.
Numerical widget
Use a Numerical Widget to set a filter on continuous numerical property values.
Like the Select Widget, you set a display name in Title and configure a chosen property from the Datasource.
You set the available range of values for the Widget with Extends from/to, and the Initial Value.
Choose a Step Display Value; setting this information after the default <%= value %> in the text-field.
Lastly, set the increment/decrement for the slider in the Widget in Step Value. Click Save.
Numerical range Widget
This Widget is related to the Numerical Widget, applying to numerical property values. However, it selects a range, rather than a singular value. As such, the Numerical range widget is particularly suited to properties with continuous values.
As before, you set a Title and Property name.
Configure the range and start values in Extends from/to and in Initial Min/Max Value, respectively.
Step value sets the default step increment for the slider on the HxGN Smart Sites Client. Click Save.
Time stamp Widget
The Time stamp Widget allows users to filter the data on the map by specifying a single date/time. The filtered Datasource should have a start, and an end date/time property expressed in ISO 8601.
You have to set a Min/Max Property name as they appear in the Datasource. This sets the range of potential values for
the slider Widget on the HxGN Smart Sites Client.
The Min/Max Property format determines the query for your Datasource, and should follow the correct
structure.
The Initial Min/Max Value sets the initial filtered values. Click Save.
Time range Widget
This second Time Widget lets users filter data on the map that with date/time property values that fall within the chosen range.
As with the Time stamp Widget, set a Min/Max Property name and Min/Max Property format.
The first determines the extent of the slider. Like Numerical range, you set Initial Min/Max Value.
Click Save.
A Datasource can only have one Time Widget defined, either Stamp or Range.
Protocols & Widget types
Mapping protocol to available Widgets
| PROTOCOL | WIDGET(S) |
|---|---|
| WFS | Height, Select, Numerical Range, Time range, Time stamp |
| WMS | Height, Numerical, Time stamp |
| OGC 3D Tiles | Height, Select, Numerical Range, Time range, Time stamp |
Setting Focus
Global properties
As stated earlier, Datasources can have the same global properties. For HxGN Smart Sites, these are represented in the Time and Height Dimensions.
These Dimensions represent the same properties in a standardised format. As such, the HxGN Smart Sites Client visualizes them in the same Widget. Having a single Widget for these Dimensions clarifies why only one Time Dimension can be set per Datasource.
Datasource-specific properties
Properties unique to a Datasource do not share the same characteristics; this means they can’t be shown on a Widget simultaneously. Users choose the Dimension of a Datasource they want to see by setting Focus on the corresponding Publication. This allows them to use the Widget to filter on that property.
Example
Let’s explore this feature using the Cities Datasource you created earlier. Here, you will add a Select and a Numerical Range Widget.
Select
Say you want to be able to filter cities from a certain State. This property is Datasource-specific; use a Select Widget.
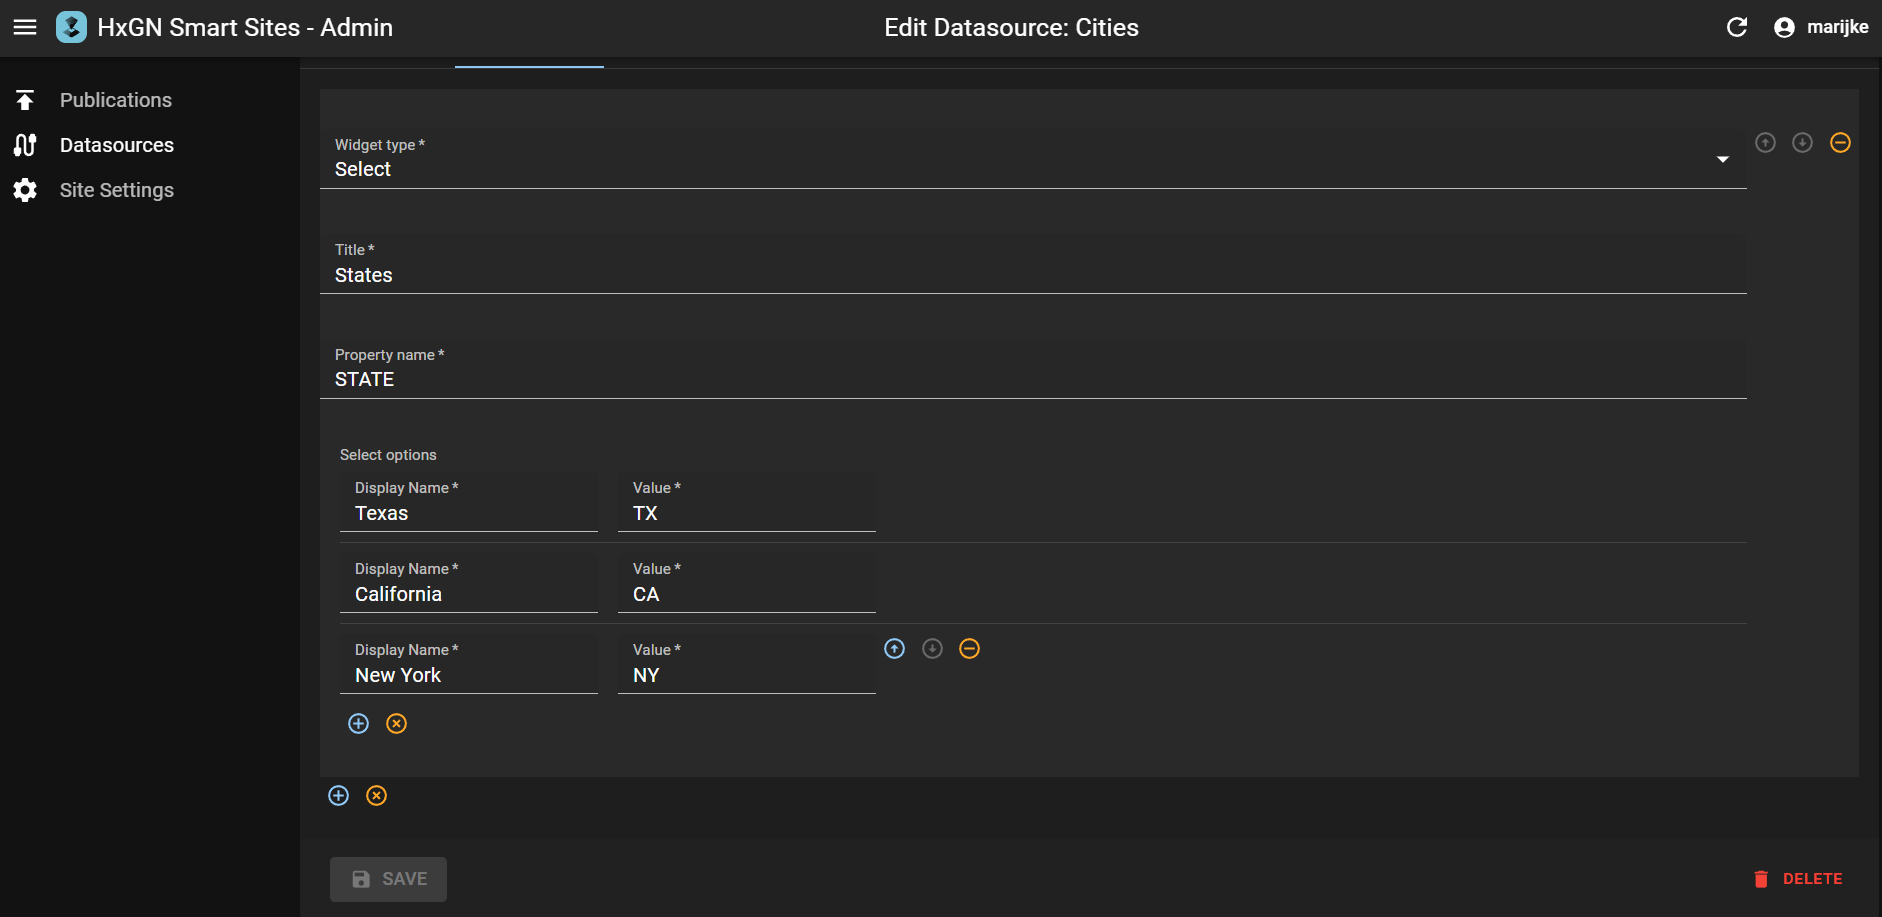
In the HxGN Smart Sites Admin, navigate to the Dimensions tab on your Cities Datasource. For Widget type, choose Select from the drop-down menu. Let’s title this 'States'.
To know what to enter in the other fields, inspect what a feature looks like in the data
{
    "type" : "Feature",
    "id" : "SHP_0",
    "geometry" : {
      "type" : "Point",
      "coordinates" : [ -81.521499, 41.0804 ]
    },
    "properties" : {
      "CITY" : "Akron",
      "STATE" : "OH",
      "TOT_HU" : 96372,
      "TOT_POP" : 223019
    }
  }
The property name you need is STATE.
Choose states from the json and give them an appropriate Display Name.
Lastly, press Save.
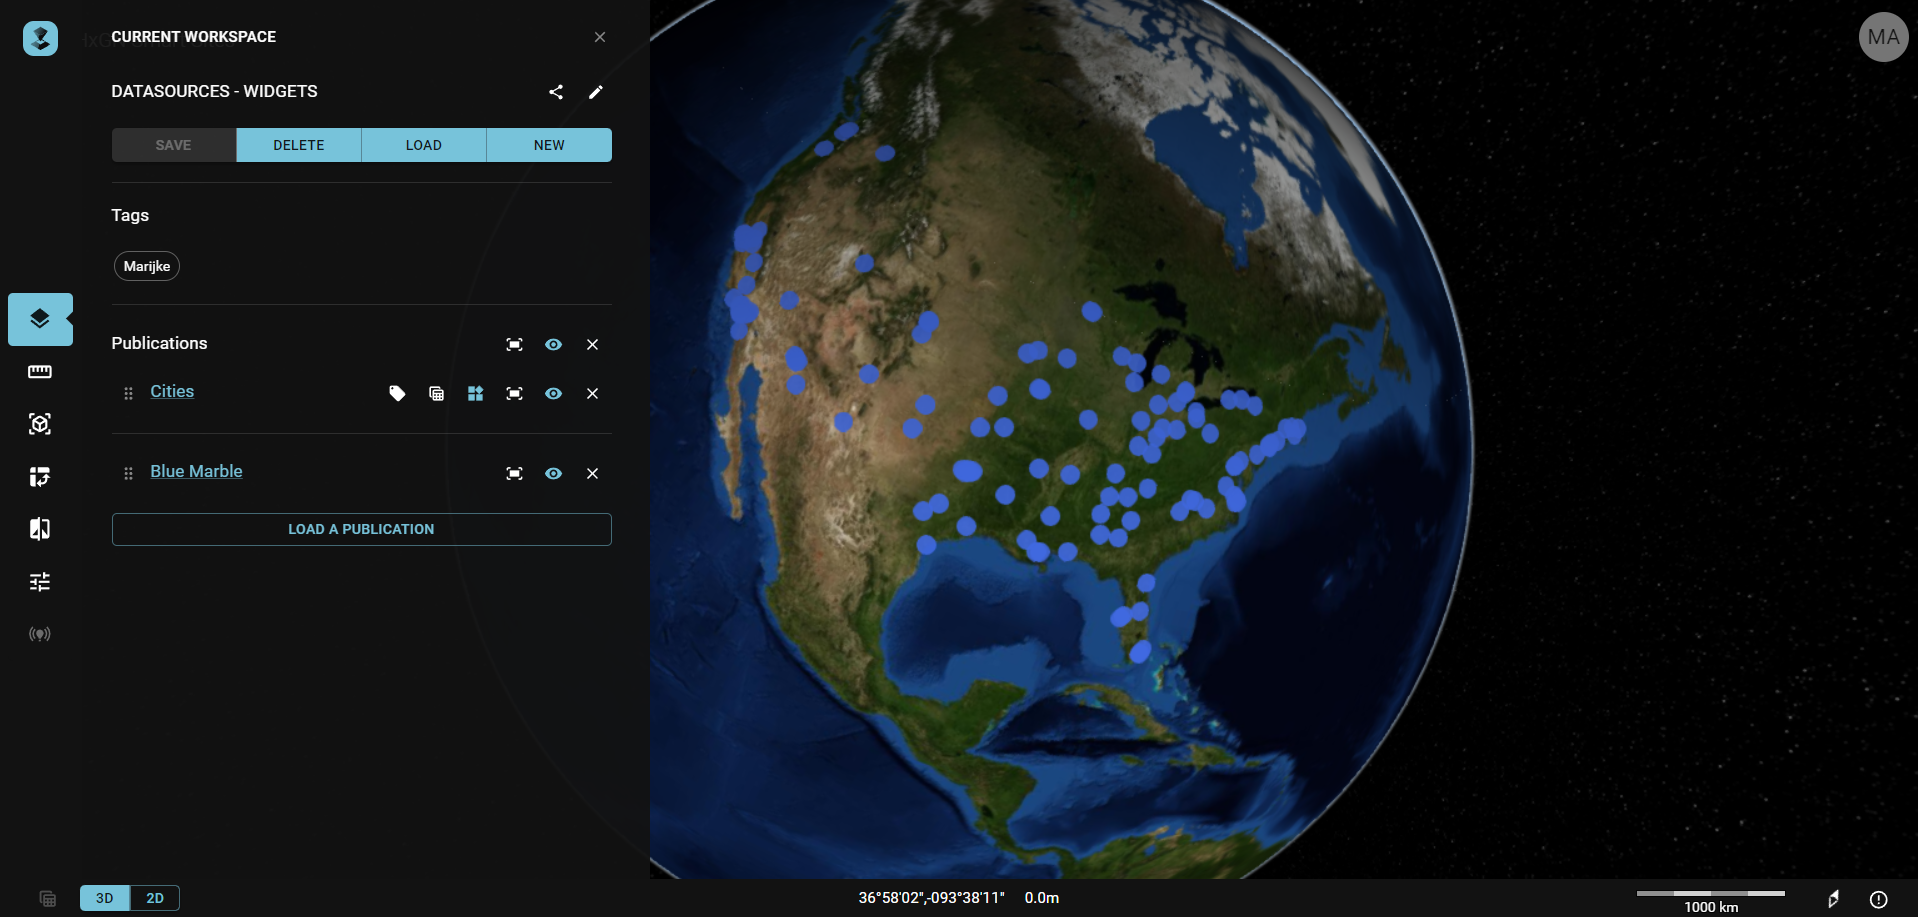
In the HxGN Smart Sites Client, load a Workspace and the cities Publication. Set focus on Cities and navigate on the map to North-America.
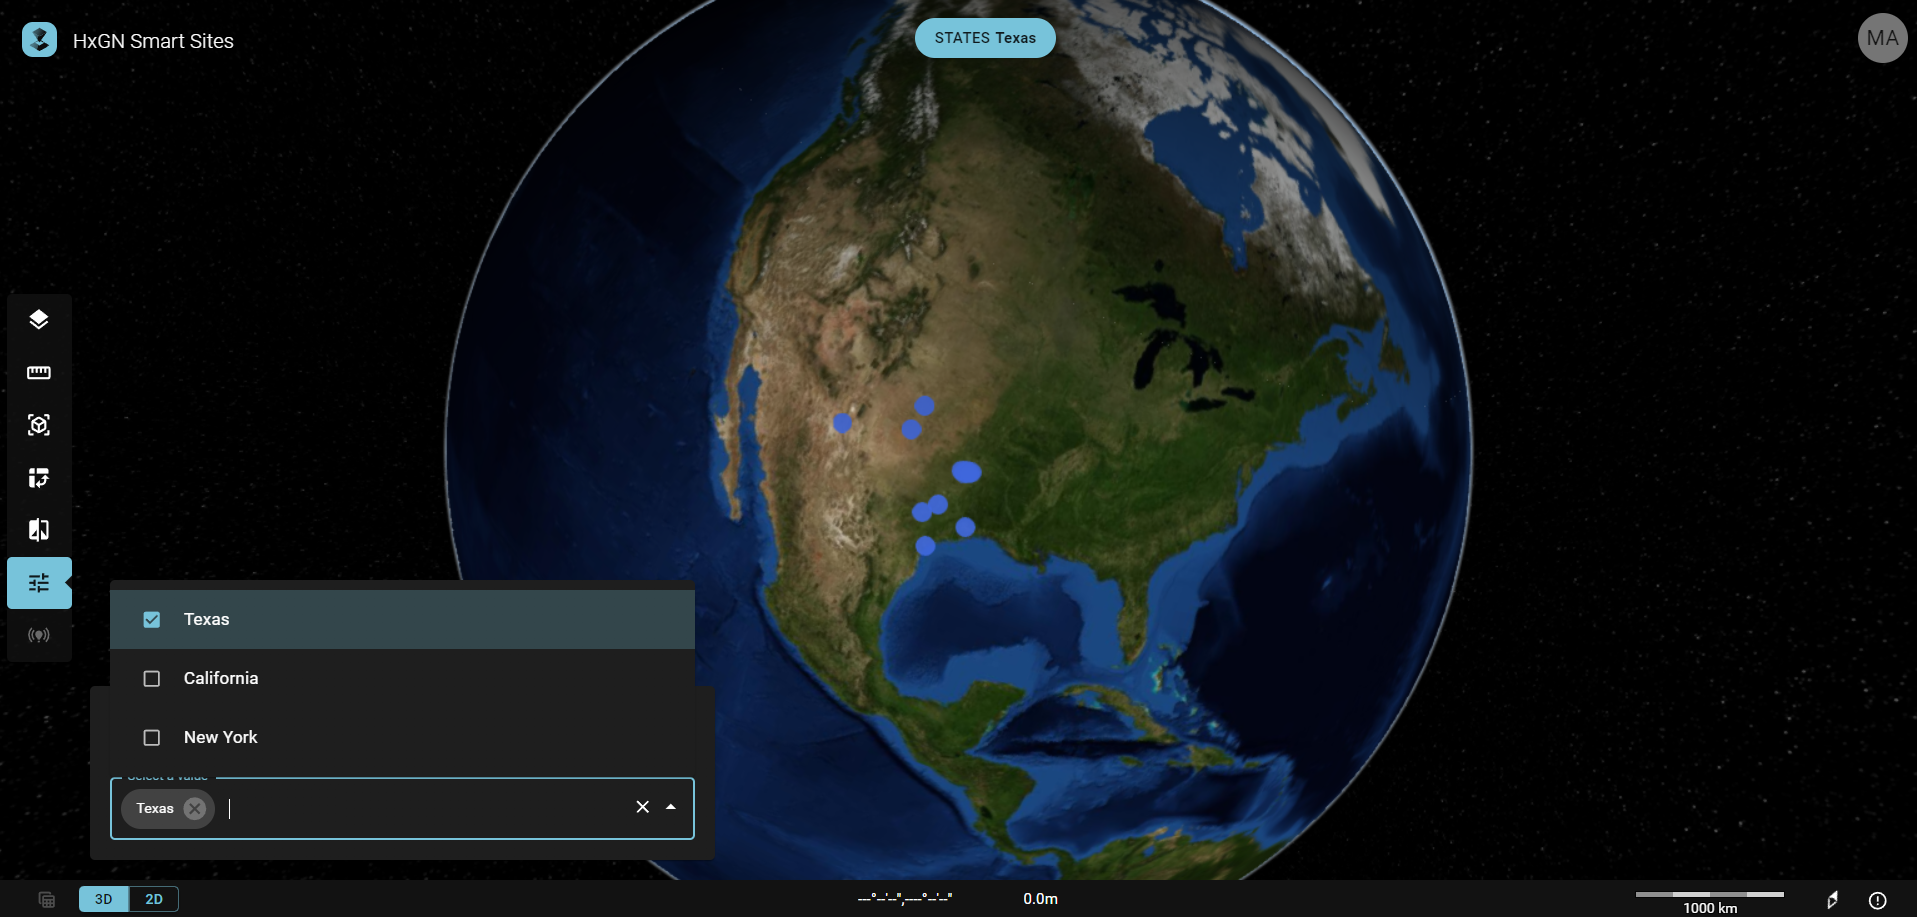
Turn on the Dimensional filters and select the value Texas.
Numerical Range
Next, you want to filter cities on their population size.
In HxGN Smart Sites Admin, go back to your Cities Datasource Dimensions and click Add. Select the Numerical Range Widget type. For Title, choose "Total Population". As you can see in the data, the Property name is "TOT_POP".
The minimum and maximum values of this property are 223.019 & 7.322.564, respectively. Set the extent and Step Value accordingly. Click Save.
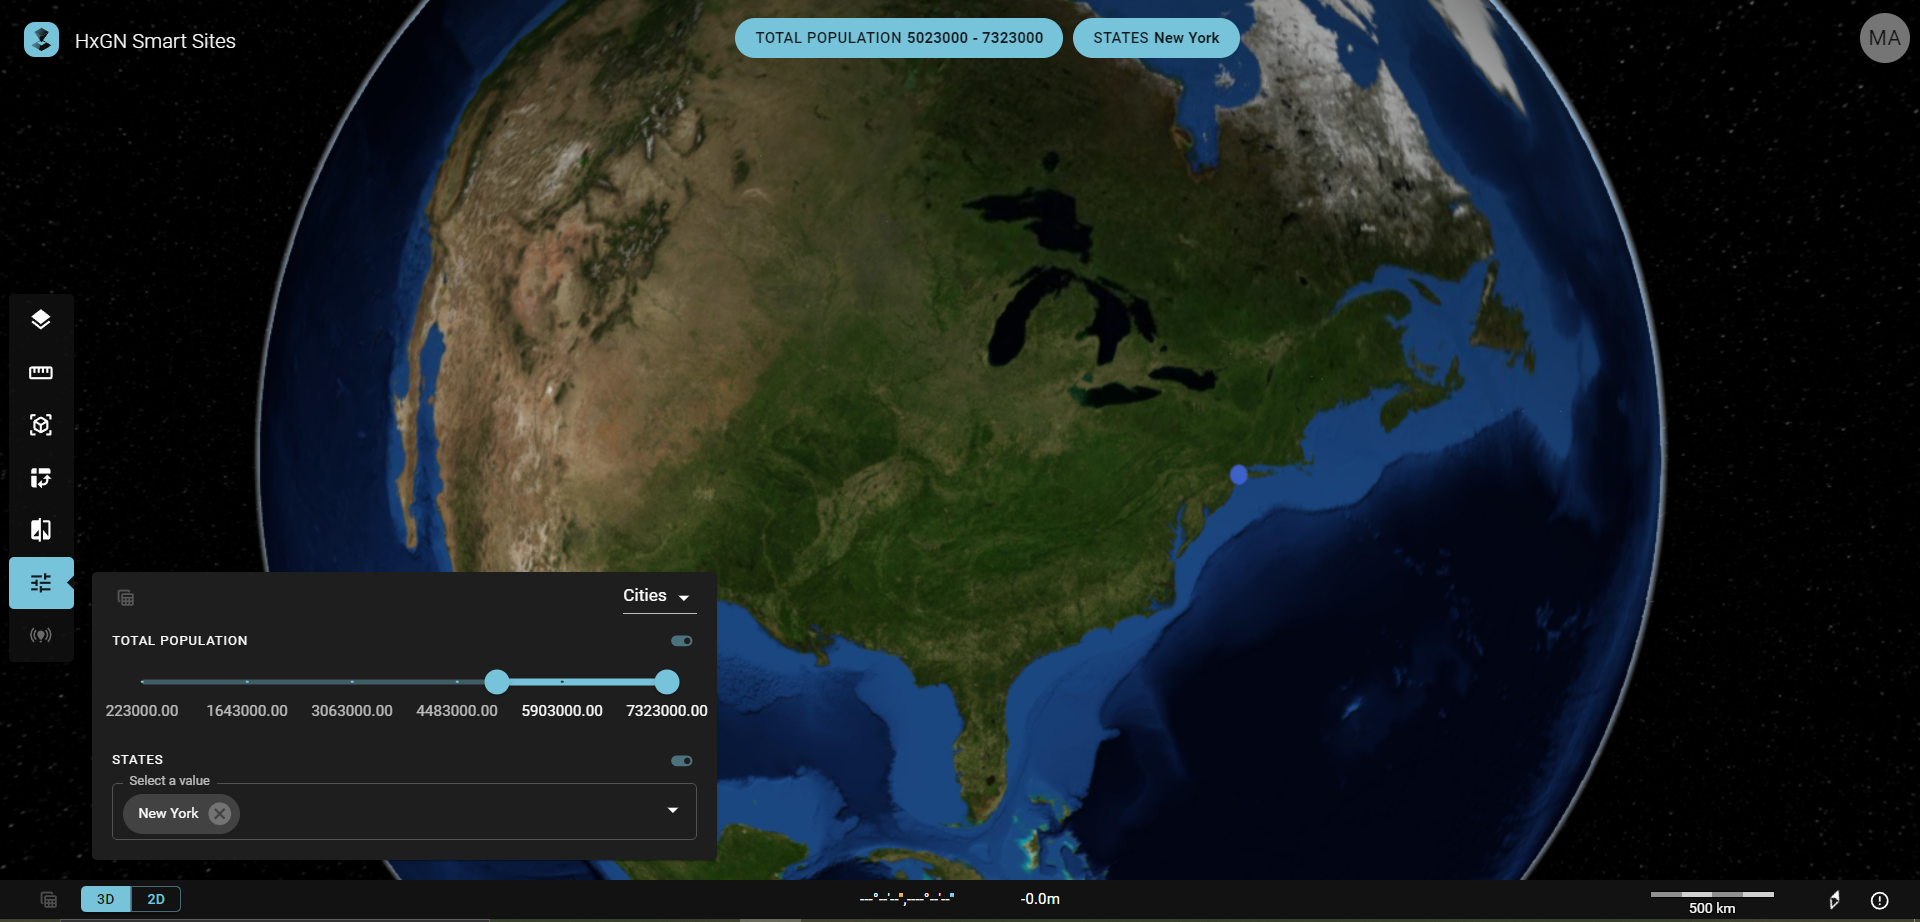
In the Client, you now have an additional dimensional slider filter; total population. You can use this and even combine both filters, for example to find cities in New York with a population size larger than 5 million.